

In today’s data-driven business landscape, not only CEOs but all line managers and specialists need tools that provide clarity and precision to make informed decisions quickly. Data Visualization with Power BI, by Alex Kolokolov, is tailored for this exact purpose, offering executives the insights and skills to transform complex datasets into powerful visuals. The book addresses a common issue—gaining timely, accurate insights without drowning in raw data.
Critical Issues Many Companies Face
- One of the critical issues Data Visualization with Power BI addresses is the common practice of building reports that adhere to outdated conventions, often because clients or executives expect them. Even highly skilled analysts sometimes deliver dashboards that mirror traditional Microsoft Excel layouts, with static tables and dropdown-heavy views that can clutter the screen and dilute insights. Today’s leaders need streamlined, interactive dashboards that reveal key metrics at a glance.
- The book offers actionable insights and techniques to foster collaboration between data experts and C-suite executives, helping to shift from old-school reporting to high-impact data visualizations. This knowledge, aimed at managers, leaders and data professionals, is designed to enhance strategic decision-making across organizations.
Microsoft’s extensive ecosystem tends to cater to technical users, often leaving business professionals, managers and executives without IT backgrounds struggling to maximize tools like Power BI. These users may attempt to leverage Power BI for reporting, only to find the process challenging and unintuitive, leading them to abandon the tool. Alex Kolokolov identified this issue and developed an innovative approach, aiming to make Power BI more accessible to all business professionals—not just tech experts. His book, Data Visualization with Power BI, offers step-by-step guides that cater specifically to the needs of non-technical users, filling a unique gap in the market. While not a simplified “Power BI for Dummies,” this resource provides a structured, user-friendly guide for managers, executives, and decision-makers who need quick, effective insights from their data without a deep dive into technical details. Guidelines and clear explanations make Power BI a valuable tool for professionals across industries.
Power BI: Transforming Decision-Making
Executives have long relied on data to make decisions, but Power BI brings a new dimension to data visualization, allowing leaders to instantly access essential insights on performance, trends, and growth opportunities. This book is a roadmap to leveraging Power BI to build real-time dashboards, track KPIs, and visualize metrics that highlight both risks and growth opportunities.
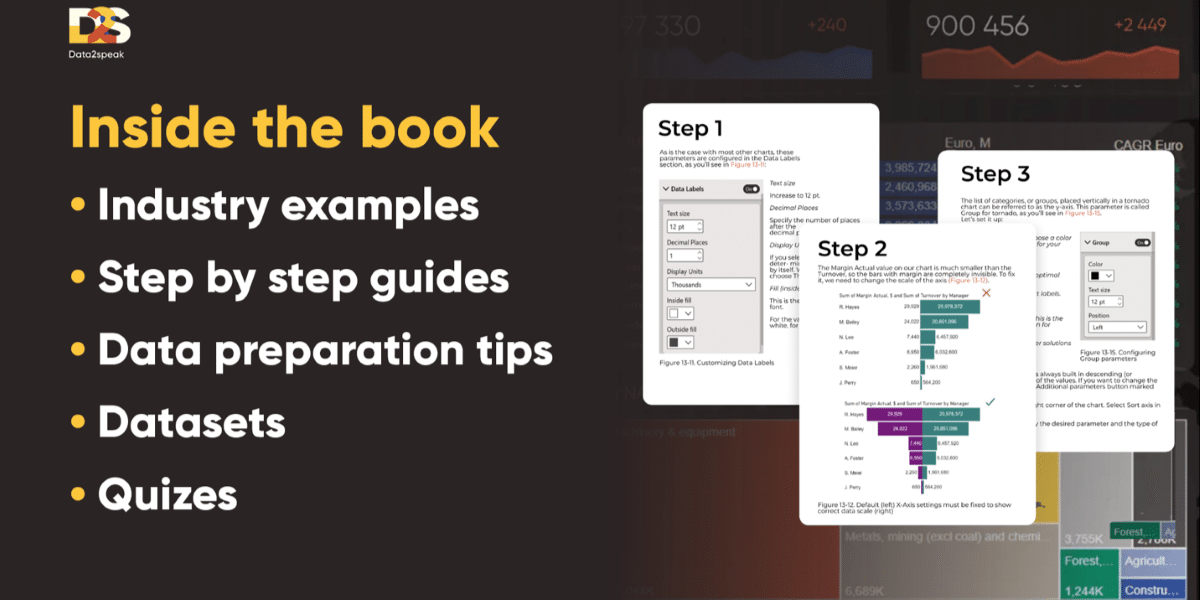
The Benefits of the Book that Reveal the Power of Data Without the Complexity
- Immediate Access to Key Insights: The traditional approach of wading through numerous slides and spreadsheets is inefficient. With Power BI’s interactive dashboards, executives can monitor the health of their business in real-time, making it easier to adjust strategies swiftly.
- Advanced Visuals for Strategic Impact: The book goes beyond basic charts, introducing executives to visuals like tornado and funnel charts, which are especially useful for high-level strategic analysis. These visuals give CEOs a nuanced view of performance, helping them see connections and impacts across different parts of the business.
- Data Storytelling: For leaders, data storytelling isn’t just about visuals; it’s about clarity. The book highlights the principles of data storytelling, explaining how the right visuals can simplify complex data and make it easier to communicate insights with boards, stakeholders, and employees.
- Step-by-Step for Executives and Analysts Alike: The book’s accessibility is one of its strengths, catering to executives and data teams needing a refresher on effective methods. The structured approach in Data Visualization with Power BI empowers anyone in an organization to navigate directly to the section they need, find relevant visuals, and understand their implications instantly.
How Power BI Can Shape the Strategy
For today’s corporates, time and clarity are everything. Power BI, as demonstrated in Alex Kolokolov’s book, enables professionals to move from raw data to actionable decisions without delay by making essential data insights available in seconds. This ability to interpret and act on real-time data is an invaluable asset, empowering leaders to make informed, proactive choices that drive sustainable growth.
In a world where data literacy is increasingly essential, Data Visualization with Power BI positions professionals at the forefront of data-driven leadership. Alex Kolokolov’s insights equip everyone with technical skills and a framework for transforming data into a strategic resource that aligns with their vision for the business.
Published by Nicholas A.