


By: Reunioninfra
The ITC vs PTC decision has never carried more weight than it does heading into 2026. What used to be a fairly routine tax election has quietly become one of the most consequential calls a CFO makes before Final Investment Decision (FID). With the One Big Beautiful Bill Act (OBBBA) now in play and the shift toward “technology-neutral” credits under Sections 48E and 45Y, the old rules of thumb no longer hold.
Get this wrong at FID, and you’re either leaving millions in phantom value on the table or walking into an unexpected recapture liability post-construction. What follows is a practical checklist of the variables your financial model must capture before you lock in your election.
1. Understand the Basic Mechanism Before Anything Else
Any honest ITC vs PTC analysis starts with what we call “Cash Flow Velocity,” the timing of when value actually hits your balance sheet.
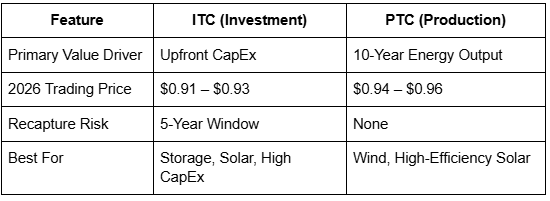
- ITC (Section 48/48E): A lump-sum credit based on a percentage of total project cost, claimed in the year the facility is placed in service. Fast, front-loaded, and balance-sheet-friendly from day one.
- PTC (Section 45/45Y): A production-based credit tied to actual kilowatt-hours generated, paid out over ten years. The 2026 rate for zero-emission facilities sits at 3.0 cents per kWh. Slower burn, but potentially far larger in aggregate.
Your model needs to account for that timing gap before you even get to the specifics.
2. Modeling the Project-Specific Variables
The right answer in any ITC vs PTC comparison almost always comes down to three project-level inputs: CapEx Intensity, Capacity Factor, and Discount Rate.
CapEx Intensity Capital-heavy projects (offshore wind, battery storage, complex interconnection requirements) tend to skew toward the ITC. The heavier the upfront spend, the bigger the ITC benefit. But for a high-output onshore wind farm in 2026, the cumulative PTC value across a decade can comfortably exceed the ITC, sometimes by a wide margin.
Capacity Factor This is where a lot of models fall apart. Engineers project 38% capacity factor; the CFO models PTC around that number. Then grid curtailment hits, equipment degrades faster than expected, and suddenly the PTC underperforms by 20%. The ITC doesn’t care how much power you actually produce. It provides a value floor that shields you from operational under-delivery.
Discount Rate The PTC is a ten-year cash flow stream, which makes it deeply sensitive to the time value of money. In 2026’s interest rate environment, $1.00 in ITC value today frequently outweighs $1.30 in PTC value spread across a decade. Run your NPV scenarios at multiple discount rates. Do not assume a single rate tells the full story.
3. Transferability and Market Clearing Prices
The ITC vs PTC choice doesn’t just affect your internal economics, it determines where you sit in the transferable credit marketplace, and that gap is meaningful.
- PTC Pricing ($0.94–$0.96 per dollar): Buyers pay a premium for PTCs because there is zero recapture risk. If a project goes dark in Year 4, the buyer keeps everything they’ve already used from Years 1 through 3. That certainty commands a higher price.
- ITC Pricing ($0.91–$0.93 per dollar): ITCs carry a five-year recapture window, which buyers price in through a steeper discount. Add mandatory tax insurance, typically 2–4% of transaction value, and the real net yield narrows further.
4. Debt Sizing and Bankability
This dimension gets overlooked constantly in early-stage ITC vs PTC modeling, but lenders notice it immediately.
Deleveraging with ITC: The front-loaded cash injection in Year 1 is tailor-made for retiring expensive construction debt fast. If your construction facility is priced aggressively, the ITC can materially de-risk your post-COD balance sheet.
Enhancing DSCR with PTC: A predictable, inflation-indexed revenue stream over ten years gives lenders something they can actually underwrite. In 2026, debt sculpting around PTC cash flows has become genuinely mainstream. Lenders are comfortable sizing larger term loans against the guaranteed credit stream, which can improve your overall debt capacity.
5. Compliance and the 2026 Reality Check
The OBBBA has added real teeth to existing compliance requirements. Miss any of these and the financial model you presented at FID becomes fiction.
PWA Compliance: Prevailing Wage and Apprenticeship failures don’t just reduce your credit, they crater it. The ITC drops from 30% to 6%; the PTC drops from 3.0 cents to 0.6 cents per kWh. That is a catastrophic outcome, not a rounding error. Your compliance audit process needs to be as rigorous as your construction timeline.
Domestic Content Bonuses: A 10% adder is on the table, but Foreign Entity of Concern (FEOC) restrictions have made it significantly harder to qualify in 2026. Model a Base Case without the bonus and a Bonus Case with it. Do not build your capital structure around incentives you haven’t confirmed.
Tax Insurance: For any ITC transaction, insurance is no longer a negotiating point, it is a market requirement. Budget for a full-wrap policy before you get to FID. Buyers won’t close without it, and your lenders expect to see it in the project budget.
Why the Tax Election Is a Financial Decision, Not a Formality
The old shorthand that solar gets the ITC and wind gets the PTC is dead. Defaulting to that framework in 2026 means leaving real project value behind, sometimes millions of it. The right answer in the ITC vs PTC debate depends on your specific CapEx profile, your production assumptions, your financing structure, and where the transferable credit market is clearing on the day you go to sell.
Treat the tax election as a financial asset, not an accounting formality. The CFO who runs multi-scenario models across all of these inputs, and builds the compliance infrastructure to protect the elected credit, is the one whose project pencils at IRR review. In 2026, the spreadsheet is just as critical to project success as the equipment being installed on site.
Disclaimer: The information provided in this article is for general informational purposes only and is not intended as legal, financial, or professional advice. While we strive for accuracy, we make no representations or warranties, express or implied, about the completeness, accuracy, reliability, suitability, or availability of this information. Use of this information is at your own risk.