

By: Fastgraphs
Every investor eventually reaches a point where they stare at a stock price and wonder if it actually represents a fair deal. A share priced at 10 dollars might be incredibly expensive, while another share priced at 500 dollars could be the bargain of a lifetime. To figure out what you are actually getting for your money, you have to compare that price against the underlying value the business produces.
Among all the valuation metrics available, the PE ratio remains the most frequently used. As you look through brokerage platforms, you will quickly notice there are two versions of this metric: Forward PE and Trailing PE. We will go through these versions of PE ratio to understand how they operate and help you evaluate businesses properly.
Measuring Market Expectations
Before separating the metric, it helps to understand what the underlying math tries to tell us. In practical terms, the PE ratio tells you how much money the market is willing to pay today for a single dollar of earnings. If a stock trades at a multiple of 15, investors are paying $ 15 for every $ 1 of profit the business generates.
The fundamental equation here is quite straightforward.
Valuation Multiple = P₀ ÷ E
Where,
- P₀ is the current market price
- E is the earnings per share
The current price P₀ is a known objective fact, and the earnings depend entirely on the timeframe you choose to examine. You have to decide if your valuation will be based on the money the company has already made or the money they are logically going to make soon.
What Is Trailing PE?
Many people prefer to deal with hard facts over educated guesses. The trailing price-to-earnings ratio uses the officially reported earnings for the most recent 12-month period. The formula for trailing PE is,
Trailing Multiple = P₀ ÷ E₀
Where,
- P₀ is the current stock price
- E₀ is the sum of verified earnings over the past 12 months
There is a distinct comfort in using this metric because it represents business growth that has already happened. But relying strictly on historical data comes with a significant blind spot. A company might have lost its biggest client or faces a massive new regulatory hurdle, and the historical metric will fail to reflect this new negative reality.
What Is Forward PE?
Analysts spend a lot of time attempting to predict future business profits because investing is heavily tied to what happens next. The forward PE metric relies on projected earnings for the next 12 months and assesses whether the stock is cheap or expensive based on the trajectory the business is currently on. The standard calculation shifts to accommodate these projections.
Forward Multiple = P₀ ÷ E₁
Where,
- P₀ is the current stock price
- E₁ is the estimated earnings for the next 12 months
This approach primes investors for future returns but introduces a volatile new variable. Earnings estimates are fundamentally educated guesses made from studying industry trends and management guidance, along with macroeconomic conditions. Unexpected supply chain disruptions can render earnings estimates obsolete overnight.
Comparing The Two When The Numbers Disagree
Let’s see the two PE ratio types in real-world scenarios and infer the anticipated momentum of the business.
Scenario 1: The Promise of Expected Growth
Say you see a company with,
- Historical multiple = 25
- Projected forward multiple = 18.
The math tells you that earnings are expected to increase, since for the resulting forward ratio to be lower, the expected earnings number must be getting larger. Growth companies frequently display this specific pattern. The market gladly pays a high premium for past earnings because a consensus exists that those earnings will grow.
Scenario 2: Bracing for Anticipated Contraction
Say a company has,
- Historical trailing multiple = 8
- Projected forward multiple = 16
The market is bracing for a decline in profits since the denominator Earning is expected to shrink considerably. Highly cyclical businesses like semiconductor companies show this pattern as they pass the peak of a favorable economic boom.
Strategies For A Balanced Analysis
Experienced investors rarely rely on a single isolated data point to make financial decisions. Using historical and projected metrics together provides a much clearer picture of a company. Analysts often introduce growth into the valuation formula to bridge the gap between historical fact and future expectations. The PEG ratio, or Price to Earnings Growth, normalizes the valuation against the expected expansion rate of the company.
The standard calculation looks like this.
PEG = (P₀ ÷ E) ÷ g
Where the first part of the formula is the standard valuation multiple, and g represents the anticipated annual earnings growth rate. This additional calculation helps contextualize the numbers.
- A stock with an expensive forward multiple of 30 might actually be reasonably priced if its underlying growth rate g is a sustained 35% per year.
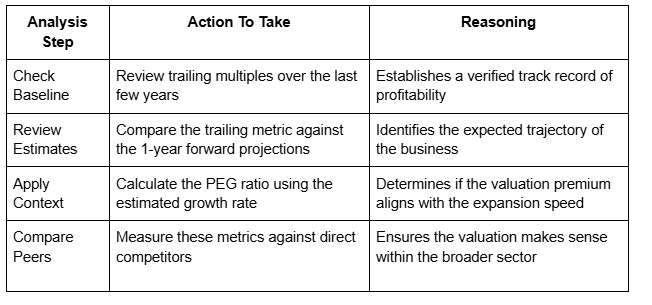
Here is how seasoned investors typically structure their overall valuation process to ensure they get a complete picture.
Why Both Metrics Belong in Your Analysis
Evaluating valuation metrics requires a mix of objective math and subjective logic. You have to understand the mathematics behind a stock price while recognizing when historical data is artificially inflated. People often assume a low PE ratio means safety, but a high multiple may actually present less risk depending on the quality of the underlying growth.
The secret to smarter investing is consistency in your research. Routinely analyze what a company has definitively achieved in the past alongside what they are logically expected to achieve in the future. That habit puts you in a much stronger position to make rational, informed decisions that compound over time.